| <Prev Next> |

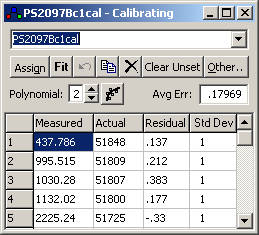
| Measured | The peak position, normally entered by click and drag on the experimental spectrum |
| Actual | The true peak position, typically entered by click and drag on the calibration spectrum after pressing the assign button |
| Residual | Observed-Calculated from last fit |
| Std Dev |
Estimated relative standard deviation of the peak position. This is used to derive the weights in the least squares fit. Only the relative values matter, so typical usage might be to use 1 for most measurements and larger values, say 3 or 10, for less accurate measurements. A negative or zero standard deviation is used to flag a point to be excluded from the fit. |
| Copy Frequency To... | Copy Frequency scale to another overlay; this process assumes
that the two overlays have exactly the same x axis (i.e. the ith point on each overlay
corresponds to the same frequency). Any x axis on the target overlay is
thus discarded. (Contrast with "Apply
Calibration
To" below.) This is intended for use on spectra
recorded simultaneously. |
| Apply Calibration To... | Apply calibration curve to other overlay. This applies the
calibration function of the current overlay to the x axis of the target overlay, so
there is no requirement for the frequency scales to match. (c.f. "Copy Frequency to" above.)
This is intended to transfer a calibration curve of, for example,
voltage to frequency, from one spectrum to another. |
| Clear | Delete all lines |
| Set Range | Set approximate range |
| Reset | Reset calibration to default, i.e. FrequencyScale=1, FrequencyOffset=0 |
| Etalon | Given two approximately spaced peaks, find all the other |
| Spline... | Generate cubic spline though
calibration points. See Using Etalons for
some comments on usage. |