 Windows
 |
Windows |
<Prev Next> |
 Open a
parameter or data file.
Open a
parameter or data file. Shift plot
range to left.
Shift plot
range to left. Shift
plot range to right.
Shift
plot range to right.
 Compress
plot range.
Compress
plot range. Expand
plot range.
Expand
plot range.  Change
plot range to a selected
range, which can be selected by left-clicking and dragging over the
required area.
Change
plot range to a selected
range, which can be selected by left-clicking and dragging over the
required area.  Plot entire
spectrum.
Plot entire
spectrum.  Simulate spectrum.
 Cycle
through plot styles. This allows simulations for individual
molecules, manifolds or states to be shown
separately, and allows
simulations to be plotted "upside down".
Cycle
through plot styles. This allows simulations for individual
molecules, manifolds or states to be shown
separately, and allows
simulations to be plotted "upside down". Show constituent parts of spectrum (arising from different manifolds)
in different colours.
Show constituent parts of spectrum (arising from different manifolds)
in different colours. Show
total spectrum, including all manifolds.
Show
total spectrum, including all manifolds.
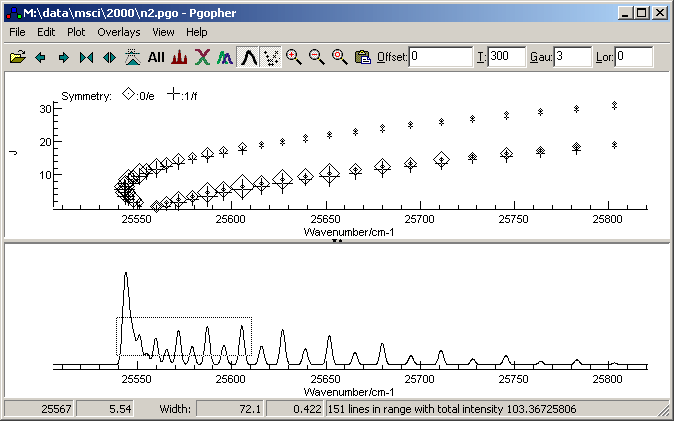
 Display Fortrat
Diagram.
Display Fortrat
Diagram.
 Show
selected region only.
Show
selected region only.  Shrink
plot.
Shrink
plot.  Reset
plot zoom to fill
window.
Reset
plot zoom to fill
window.  Paste
an experimental spectrum to
overlay the simulation from the clipboard.
Paste
an experimental spectrum to
overlay the simulation from the clipboard.| Offset | Useful for lining up experimental spectrum and simulation. Moves the spectrum by the required number of units (cm-1, MHz, Kelvin or eV, dependent on which units are selected). This can also be done by clicking and dragging the simulation with the Alt key held down. |
| T | Alters the spectral temperature. |
| Gau | Alters the Gaussian contribution to linewidth. |
| Lor | Alters the Lorentzian contribution to linewidth. |
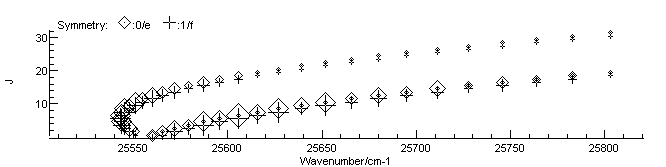 button. Different
symmetries are labeled with different symbols - see the key at the top
of the diagram. The J plotted
can be upper or lower state, as set in the plot menu.
button. Different
symmetries are labeled with different symbols - see the key at the top
of the diagram. The J plotted
can be upper or lower state, as set in the plot menu.