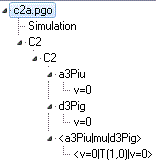
This shows an example of an electronic spectrum.
The constants are taken from G. M. Lloyd and P. Ewart,
J Chem. Phys. 110, 385 (1999). The line
positions agree with the calculated line positions from the paper
to about 0.0001 cm
-1. A small adjustment was required
to the constants - the difference between
pD+2
qD between the two
states is taken to be -9.42 rather than -0.942 as given in Table
II. (The value given in Table II is not the value quoted by Prasad
and Bernath as quoted in the footnotes to the table.) Note that
LimitSearch="True" is
required for the F1/F2/F3 quantum numbers to be calculated
correctly. See below for a larger example involving several
vibrational states.

This is a more complicated
example, including many vibrational bands. Note that all the
vibrational states of a given electronic are all in the same
manifold, though this is not essential. The constants are taken
from A. Tanabashi, T. Hirao, T. Amano and P. F. Bernath,
Astrophys. J.
SuppSer.
169, 472 (2007), with the
transition moments calculated from the Einstein
A
coefficients given in J. S. A. Brooke, P. F. Bernath, T. W.
Schmidt, and G. B. Bacskay,
J Quant. Spect. Rad. Trans,
124,
11 (2013). The calculated line positions agree with the line
positions given by Tanabashi et al for clear, unperturbed lines
with an average error of 0.03 cm
-1. There are some
known local perturbations which are not included in this model.
Note that this was updated in Feb 2017; the previous version had
several estimated constants.
This data file is set up for absorption, though
the Swan bands are most commonly seen in emission. To transform to
an emission spectrum set
Initial
to true for the d state and false for the a state, and follow the
other instructions under
Emission Spectra.
 This shows an example of an electronic spectrum.
The constants are taken from G. M. Lloyd and P. Ewart, J Chem. Phys. 110, 385 (1999). The line
positions agree with the calculated line positions from the paper
to about 0.0001 cm-1. A small adjustment was required
to the constants - the difference between pD+2qD between the two
states is taken to be -9.42 rather than -0.942 as given in Table
II. (The value given in Table II is not the value quoted by Prasad
and Bernath as quoted in the footnotes to the table.) Note that LimitSearch="True" is
required for the F1/F2/F3 quantum numbers to be calculated
correctly. See below for a larger example involving several
vibrational states.
 This is a more complicated
example, including many vibrational bands. Note that all the
vibrational states of a given electronic are all in the same
manifold, though this is not essential. The constants are taken
from A. Tanabashi, T. Hirao, T. Amano and P. F. Bernath, Astrophys. J. SuppSer.169, 472 (2007), with the
transition moments calculated from the Einstein A
coefficients given in J. S. A. Brooke, P. F. Bernath, T. W.
Schmidt, and G. B. Bacskay, J Quant. Spect. Rad. Trans, 124,
11 (2013). The calculated line positions agree with the line
positions given by Tanabashi et al for clear, unperturbed lines
with an average error of 0.03 cm-1. There are some
known local perturbations which are not included in this model.
Note that this was updated in Feb 2017; the previous version had
several estimated constants.