|
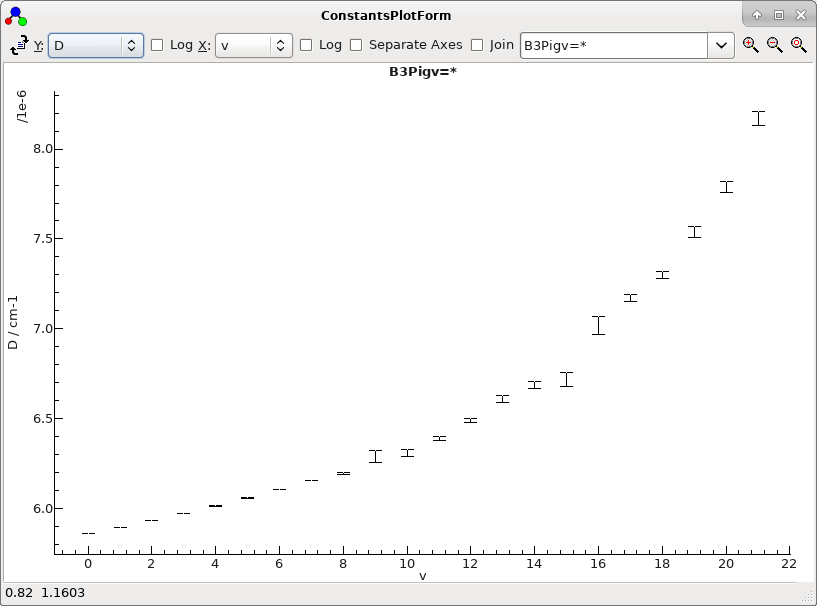
Replot constants.
|
  |
Select constant to plot. This list is populated with all
non-zero parameters from the selected states, and an "All"
entry.
|
  |
Select the x axis; possible values are:
- Index: Running number for the plotted states, starting
from 1
- Sub-Index - index within manifold, starting
from 1
- v - vibrational quantum number, taking it
from the last number in each state name.
- Origin - the state Origin.
- Offset - the offset of the origin from the
lowest state in the manifold.
|
 |
Take Log10(Abs(value)) |
 |
Select the states to plot. A "*" is used to indicate the
pattern of identified quantum numbers.
|
 |
If checked, use a separate axis for each type of constant;
the vertical scale is shown as 0.0 - 1.0.
|
 |
Join constants for each state when plotting.
|

|
Zoom to region selected by mouse. |
 |
Shrink plot |
 |
Reset plot zoom to fill window |
 Windows