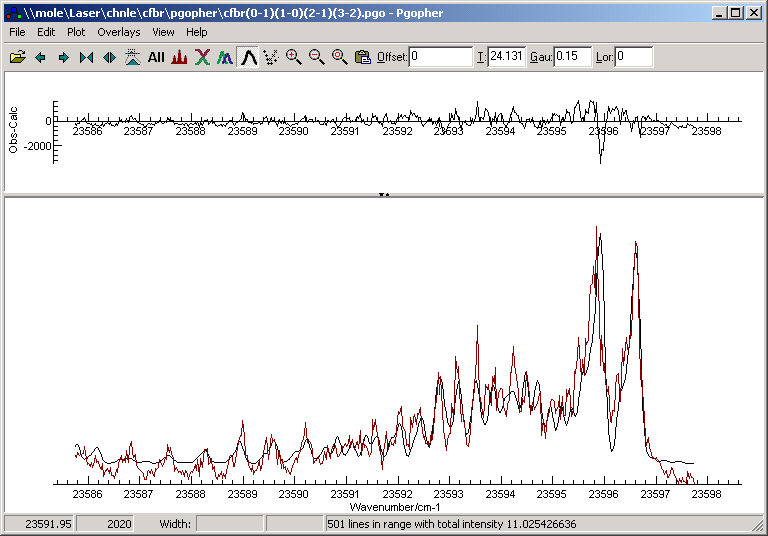
Contour fitting allows fitting the overall
shape of an experimental spectrum to a simulation, and is useful
for low resolution spectra in which the rotational structure is
not fully resolved. It is also appropriate for determining
temperature or population distribution for a known band. Note that
the results from this sort of fit are typically less reliable than
for a
line position fit, and a line
position fit is to be preferred to determine rotational constants.

The log window will show details of the fit,
including estimated standard deviations of the parameters. The
standard deviations are calculated using the standard methods
for least squares fitting, using derivatives estimated with
numerical differences, but experience with contour fitting
indicates that the error bars on the parameters are typically
too small, and the most reliable estimates of the error are
obtained by comparing the results of fits to different data
sets.
