 |
Open a parameter or data file |
 |
Shift plot range to left |
 |
Shift plot range to right |
 |
Compress horizontal plot range |
 |
Expand horizontal plot range |
 |
Change horizontal plot range to a range selected with mouse. |
 |
Plot entire spectrum |
 |
Simulate spectrum |
 |
Cycle through plot styles. This allows simulations for
individual
molecules, manifolds or states to be shown
separately, and allows
simulations to be plotted "upside down". |
 |
Show constituent parts of spectrum in different colours. For
this to work, colours should be set for the states or other objects.
|
 |
Toggle display of total spectrum.
|
 |
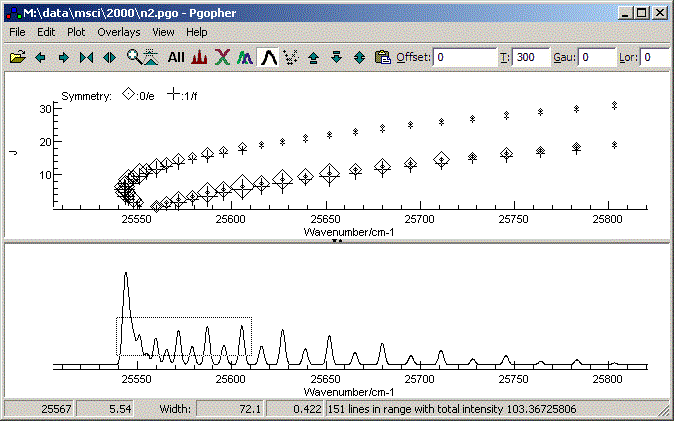
Toggle display of Fortrat Diagram |
 |
Magnify distance from bottom |
 |
Magnify distance from top |
 |
Toggle auto vertical scale |
 |
Paste a spectrum to overlay the simulation from the clipboard |


 button. Different
symmetries are labelled with different symbols - see the key at the top
of the diagram. The J plotted
can be upper or lower state, as set in the plot menu.