| <Prev Next> |
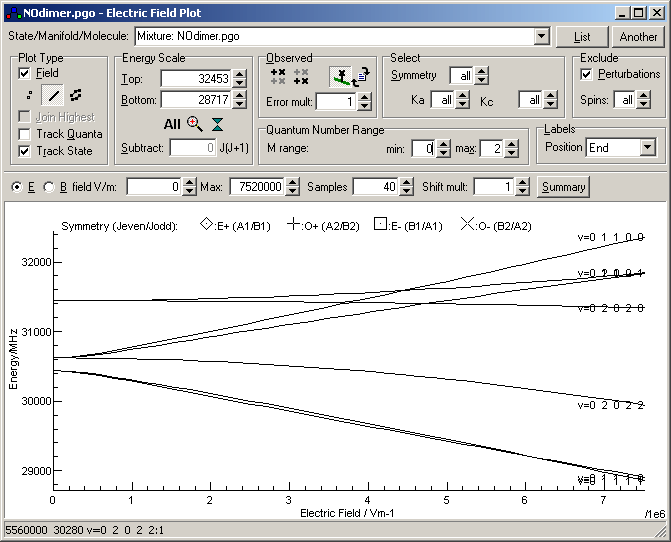
If the  box is selected, the energy
level plot window will plot the energy levels as a function of
electric or magnetic field, rather than as a function of quantum
number. Additional controls become visible at the bottom of the control
panel to control this plot. Most of the other controls operate the same
in both modes, so
see the energy
level plot window documentation for details.

 |
The quantum number range selects the
range of the projection of the total angular momentum along the field
direction, M, that is
calculated and plotted. |
  |
Minimum M to include in plot |
  |
Maximum M to include in plot |