| |
<Prev Next> |
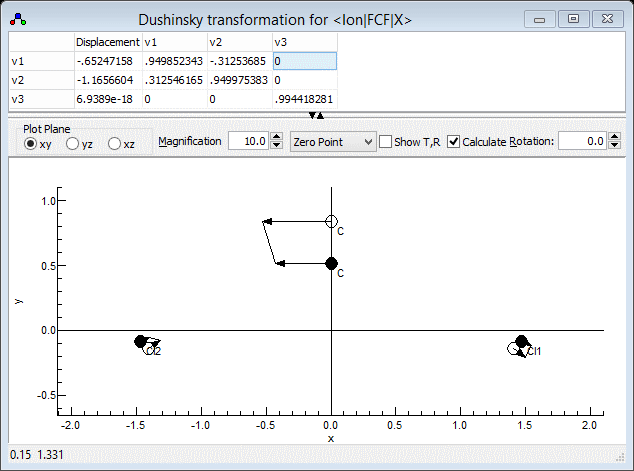
This window displays the normal mode
displacements (K) between
two electronic states, and the Dushinsky transformation matrix (J) between them. If the
information is available, then the geometries and normal modes for
the two states are also displayed. To bring up the window right
click on the transition moment between the two states and select "Dushinsky Matrix...".

The lower panel, visible if nNuclei for the molecule
is > 0, shows the atom positions and normal modes for each
state. The atoms for the state shown in the bra (here Ion)
are plotted with open circles for the atoms and the atoms for the
state in the ket are shown as filled circles. To plot a particular
normal mode, click on the appropriate column, or click on the "Displacement" column to
just show the atom positions. In these plots the matching atoms or
atom motions are joined by dotted lines - this allows for a check
that the same choice of axes and atom and mode numbering has been
made for the two states. (This can also show as large off-diagonal
elements for the Dushinsky matrix, or negative values on the
diagonal.) If the states have been set up inconsistently, then the
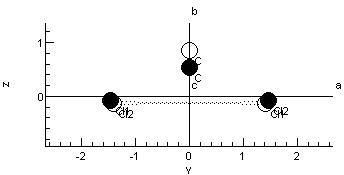
intensity calculations may not be correct. For example if the two
Cl atoms in the above example were swapped between the two states
then the atom position plot will look like:

This particular problem could be
solved by right clicking on the appropriate atom and using the
"Move Up" command. Other possibilities include changing the order
or sign of the modes.
 |
Drag to resize the upper and lower parts. |
 |
Displacements along the normal co-ordinates, J. If
"Calculate" is
not selected, these can be edited in this window. |
 |
Dushinsky transformation matrix (J) between normal coordinates. |
 |
Select plane to plot |
  |
Scale factor for normal mode zero point displacements |
| Select arrows plotted - see The l Matrix Window for details. | |
| Show Translational and Rotational normal mode transformations. | |
 |
Select for normal mode displacements and the Dushinsky matrix to be calculated from the l matrices and equilibrium geometry for the two electronic states. If not set, the values are taken from the modes under the Multidimensional Franck Condon Factor object. |
| Rotates the plotted image by the given angle about the horizontal axis. |