| |
<Prev Next> |
Line lists in .par format from the HITRAN database
(or line listings with the same format) are understood by PGOPHER
and can be used in several different ways. At its simplest, the
line positions and intensities can be overlaid as an
"experimental" spectrum in an overlay,
but the files can also be used as input to line position or
intensity fits (PGOPHER can use the quantum numbers in
the file) or imported as an external source allowing more general
application of many of the features of PGOPHER, such as energy
level plots, in addition to standard simulations.
The format of the HITRAN .par format is
documented in "The HITRAN 2004 molecular spectroscopic database",
J. Quant. Spectrosc. Radiat. Transfer 96, 139 (2005). The extension is typically .par.
Both the older 100 character line and the newer 160 character line
formats can be read. Lines that do not begin with a number are
ignored, but all other lines must be exactly 100 or 160 characters
in length. If using the new HITRAN online interface at http://hitran.org/ select .par
(160 chars) as the output format. (Alternative output formats may
be handled by future versions.)
There are three different ways of using HITRAN
files:
To overlay a linelist simply load the .par file using File,
Load Overlay, or simply drag and drop the .par
file onto the PGOPHER window. (For this to work
extension must normally be .par, as PGOPHER
uses this to determine the file type.) This mode is the least
flexible, as the only adjustment possible is the addition of a
constant width to the lines if the Convolute
option is set in the Experimental
Plot.
The values in HITRAN files can also be used as input to line position or intensity fitting. To fit to energy levels, use the procedure for line position fitting with line lists in separate files, for which the .par file can typically be used without modification. For fitting the extension must be .par, as PGOPHER uses this to determine the file type. The quantum number format can normally be determined automatically, but a globalclass n directive can be added to the start of the file to specify the molecule type if necessary. The number corresponds to the entries in Table 3 of the "The HITRAN 2004 molecular spectroscopic database", J. Quant. Spectrosc. Radiat. Transfer 96, 139 (2005). upperstate/lowerstate and related directives described in Line List Input Format can be used to specify the states involved, if there is more than one possibility, or alternatively the states can be named following the global class quantum numbers. The names required are the "global" quanta for the state, with the fields separated by "_". The same procedure can be used to determine the transition dipole moments by fitting to the Einstein A coefficients in the .par file - select Intensity rather than Line in the log window to use this mode, and the IntensityUnits in the Simulation must be cm2WavenumberperMolecule.
The examples below use 14_hit04.par containing the HF linelist
from the 2004 HITRAN release. (Other versions should give
similar results, though the 2012 version will show additional
lines from DF.)
To display the linelist, simply drag and drop the .par file
onto a PGOPHER window:

Import the file to allow more flexible usage: Use File,
Import, HITRAN File..., and select the .par
file. For higher temperatures the partition function should be
taken from HITRAN. To do this right click on the HITRANMolecule
object (141 for HF) and select Add New..., Interpolated
Partition Function and then right click on the Interpolated
Partition Function object and select the parsums.dat
file from the HITRAN distribution. In the following dialog box,
make sure HF is selected in the Q column, and no other rows. For
some molecules the Abundance
will need to be set; for HF there is only one isotopologue in
the .par file but, for example, an HCl linelist would
require 0.75 and 0.25 to be entered for the 35 and 37 isotopes
of Cl.
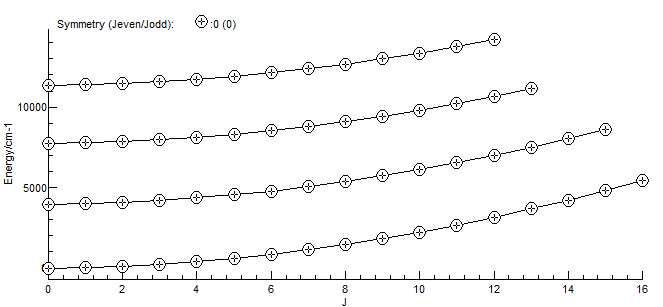
The resulting spectrum will look the same as the above by default, but it is now possible to right click on a line to show the quantum numbers associated with the transition, and the temperature can be changed from the default. It is also possible to produce an energy level plot (View, Levels):

Note that HITRAN only provides partition functions staring at
70 K; for lower temperatures it is probably more accurate to
delete the Interpolated Partition Function (or make it
inactive), as the energy levels inferred from the HITRAN file
are likely to be complete for lower temperatures.
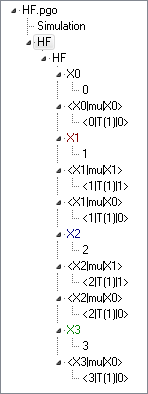
 The file HF.pgo
is a standard PGOPHER linear molecule file, set up to
simulate all the transitions in the .par file. Four
vibrational levels are included in the model. The rotational
constants (Origin, B, D and H) were
determined by line position fitting using the .par file
unmodified as the observations file. For this to work the
vibrational states need to be named "0", "1", "2" and "3". The
transition dipole moments were determined by a second fit to the
same file, with the fit type set to Intensity rather
than Line; the intensity units for the simulation need
to be cm2WavenumberperMolecule. The partition function
is calculated by a sum over all four vibrational levels rather
than using an imported table; to allow the partition function
values to be compared with HITRAN SymWt has been
set to 4 to allow for the two spin ½ nuclei.