 Windows
 | Windows |
<Prev Next> |

| If fitting using the Log Window, reload observations and recalculate plot.If fitting using the Line List Window, use the Test button instead. | |
| Maximum distance to observed lines - controls vertical range of plot. | |
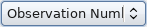 |
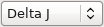
Select the X
axis of the plot. Possible choices are:
|
 |
Check to use upper (rather than lower) state quantum
numbersfor the X axis. |
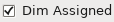 |
Plot assignments grayed out |
 |
Plot log10(Abs(X)) |

|
Show filename changes when x axis is observation number
and the observations are in multiple files |
 |
Choose how to select the mark styles:
|
 |
Select plotted transitions using the Transition Selection and Details Window. |
| Offset of plot window | |
| Enable common difference filter - only plot transitions
satisfying common difference to the tolerance set in the
text box. |
|
 |
Highlight lines with no possible assignment in range |
| Zoom plot to region selected with mouse. | |
| Shrink plot | |
| Reset plot zoom to fill window |
To bring up this menu right click on the point(s) of interest
Draw a box with the mouse before right clicking to operate on
multiple points.
| Edit Point | Prepare point under cursor for editing:
|
| Show Transition | Shift main plot to show transition that the indicated
point derives from. (You may want to expand the plot several
times to show the detail.) |
| Show and Edit | Perform both actions above. |
| Clear Point(s) | Set* weight of points under cursor to zero. |
| Clear Points Inside | Set* weight to zero for points inside the
region selected by the mouse. |
| Clear Points Outside | Set* weight to zero for points outside the region selected by the mouse. |
| Delete, Delete Point(s) | Delete* points from line list. |
| Delete, Delete Points Inside | Delete* points inside the region selected by the mouse. |
| Delete, Delete Points Outside | Delete* points outside the region selected by the mouse. |
| Assign Point(s) | Assign points from current line list |
| Assign Points Inside | Assign points inside selected area from current line list |
| Assign On Diagonal | Assign points near to diagonal line in selection |
| Copy to clipboard | Use Paste Special to paste picture or underlying data (if available) in the target application |
| Print... | Show print preview and allow print of plot |
| Export to file... | Export plot to external file |
| Font... | Choose font for graph text |
| Variable Char Size | Character size on printer and clipboard depends on window size |
| Limit Line Segments | Limit number of segments on a plotted curve. Leave this checked unless you have problems with the graph when printed or exported. |