Molecule Types Vibrational Structure Vibrational Energy Levels and Franck-Condon Factors <Prev Next>

Worked Example - Predicting the Photoelectron Spectrum of H2O using ab initio Calculations

ab into programs can be used to calculate the normal mode information required to simulate electronic spectra including Franck-Condon factors. The key parameters required for are summarized in Making a data file for simulating vibrational structure from l matrices. The steps below provide a worked example for the first band in the photoelectron spectrum of water, using ab into calculations for the required values. See the related worked example, The Photoelectron Spectrum of H2O for an alternative approach using literature values.

The ab into calculations

For this exercise Molpro is used, though many ab initio programs will produce the same information. A calculation including normal modes can be performed with the following control file:

re=1.013
r1=re
r2=re
a=109.41
basis=VDZ
geometry={
ANGSTROM;
H1;
O1,H1,r1;
H2,O1,r2,H1,a;
}

wf,9,2
hf
optg
frequencies

casscf
optg
frequencies

This performs a geometry optimization and normal mode calculation for the ground state of the ion using both Hartree-Fock and CASSCF. The same file will also work for the ground state of the neutral if the "wf,9,2" line is removed. The more recent versions of Molpro output in XML format that PGOPHER can read directly; alternatively add a "put molden,H2O.molden" command after the frequencies step. This writes out the normal mode (and other) information that PGOPHER can also read directly.

The normal mode output that is required looks like this for the neutral molecule:

 FREQUENCIES * CALCULATION OF NORMAL MODES FOR CASSCF000                       


Atomic Coordinates

Nr Atom Charge X Y Z

1 H1 1.00 0.000000000 -1.417298632 1.034331878
2 O1 8.00 0.000000000 0.000000000 -0.130322946
3 H2 1.00 0.000000000 1.417298632 1.034331878

Frequencies dumped to record 5400.2

Gradient norm at reference geometry: 0.46187D-03

Normal Modes

1 A1 2 A1 3 B2
Wavenumbers [cm-1] 1715.28 3721.36 3833.40
Intensities [km/mol] 53.05 2.68 14.45
Intensities [relative] 100.00 5.06 27.23
H1X1 0.00000 0.00000 0.00000
H1Y1 0.42031 0.56516 0.52478
H1Z1 0.53260 -0.39609 -0.43124
O1X2 0.00000 0.00000 0.00000
O1Y2 0.00000 0.00000 -0.06612
O1Z2 -0.06711 0.04991 0.00000
H2X3 0.00000 0.00000 0.00000
H2Y3 -0.42031 -0.56516 0.52478
H2Z3 0.53260 -0.39609 0.43124

Note the optimized equilibrium geometry (in atomic units), the normal mode frequencies and the l  matrix elements at the end. The latter are the relative motion of each atom in a particular mode.
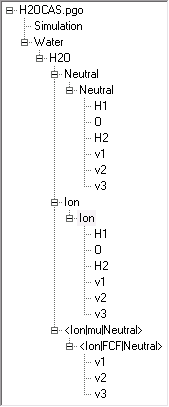
Setting up the simulation

There is now enough information to produce a basic simulation in PGOPHER. The Molpro output files are available as H2OCAS.out (neutral molecule) and H2OplusCAS.out (ion).
  1. Click on File, Import,  l Matrix... and select the ab initio output file generated as above. The description below assumes you start with the output file generated as above for the neutral molecule.
  2. Select View, Constants. You will note that two states have been generated (S0 and S1), corresponding to the HF and CASSCF stages of the calculation respectively. Only one of these is required; to use the CASSCF calculation right click on the first S0 and select "Delete". (Respond "Yes to All" to the delete linked nodes query.)
  3. Check that the imported values are reasonable using the l matrix window, which displays the geometry and normal modes. Bring this up by right clicking on the lower S1 label, and select "l matrix...". Click on "yz" to select the correct plane for plotting, and display the normal modes by clicking on the corresponding columns in the top grid. Note that the numbering and symmetries will not be right at this stage, but this is best fixed after importing the ion information. "Operate", "Print" will print checks for the centre of mass (should be at the origin) and the orthogonality of the normal modes, together with a lot of other information. It is normal for rounding errors to produce numbers slightly different from 0 and 1, but larger differences may indicate a problem with the import. "Operate", "Orthogonalize" will force the checks to be passed.
  4. For clarity, rename some of the items to more meaningful names. Right click on the item and select "Rename" to do this. The manifold and state, currently "S1" should both be something like "Neutral", and the "LmatrixImport" items could be "Water" (upper item) and "H2O" (lower item). (This structure permits isotopically substituted species in the same file - a "D2O" item could be added at the same level as "H2O").
  5. We need to set this state as the initial state in the simulation - click on the upper "Neutral" object (the manifold) and ensure "Initial" is set to true.
  6. Now import the calculations for the ion. Ensure that "Merge" is selected under the "File" menu, so that the import does not overwrite the steps above, then use File, Import,  l Matrix... again for the ion calculations. Turn "Merge" off after doing this, to avoid later confusion.
  7. A second "LmatrixImport" species with two states beneath it will have been generated by the import. As above, the second is required, so delete the "SO" objects as before. For clarity, rename both "S1" items to "Ion".
  8. Copy the "Ion" manifold to the first molecule generated above, "H2O". To do this, right click on the "Ion" manifold (the uppermost Ion item) and select copy. Next right click on the destination molecule (the H2O item) and select paste. The remaining import items can then be deleted - right click on the upper "LmatrixImport" and select delete. The final structure aimed for is shown to the right.
  9. Now check the upper state as in state 3 above, using "Operate", "Orthogonalize" if necessary.
  10. The two states must now be connected by a multidimensional Franck-Condon factor. Right click on the H2O molecule and select "Add New", "Transition Moments". A dialog will pop up asking which states you want to connect; select "Ion" as the bra and "Neutral" as the ket. Now right click on the new item, <Ion|mu|Neutral> and select "Add New", "MultidimensionalFCF". Calculate should be set to true for this item, so that the imported l matrices are used.
  11. At this point, check that the atom layout and numbering is consistent between the two imports; different choices can easily be made, especially if the imported data is for more than one source. Bring up the Dushinsky Transformation Window by right clicking on the multidimensional Franck-Condon factor, the lower <Ion|FCF|Neutral>, and selecting "Dushinsky matrix...". This plots equilibrium geometries for the two states on top of each other, and any problems should be clear from this plot.
  12. The symmetry can now be set; it is not imported automatically as full symmetry is often not used in ab initio calculations. Click on the molecule item, H2O, and set:
    1. PointGroup = "C2v"
  13. Click on each mode in the neutral ground state in turn (v1, v2 and v3 under Neutral) and enter:
    1. Symmetry - the symmetry of the mode, which you will only need to change (to B2) for the asymmetric stretch. The l matrix window will show that this has been imported as the first vibrational mode.
    2. vMax = 0. This selects the maximum vibrational quantum number to be considered in each mode. The default (3 or 5) will lead to rather a slow simulation; setting to 0 means that vibrationally excited states are excluded.
  14. To rearrange the modes to the standard order, right click on any mode and select "Sort". This will sort the modes by symmetry and then descending order of frequency. Other menu options allow individual modes to be move up or down; note the "global shift" operations affect all the states in the molecule, whereas the "Move" operations just affect the selected state.
  15. Set the ionization energy by clicking on the ion ground state, the lower "Ion", and set:
    1.  Origin = 86800 cm-1 = 10.7 eV. (The calculations described above suggested an energy difference of 0.395 atomic units.)
    2. You should also set Symmetry = B1 for the electronic ground state of the ion.
    3. Note the spin, S should be left as zero rather than ½ as PGOPHER does not have a specific calculation mode for ionization. Ignoring spin effects will be a reasonable approximation unless spin splittings are large.
  16. As a final step you may want to adjust the range of vibrational quantum numbers in the excited state considered. Click on each mode in the ion in turn (v1, v2 and v3 under Neutral) to see them; if the product of all the vMax is 100 or more the calculation is likely to become rather slow in the current version of the program.

Press the simulate button (Simulate) and then the all button (all) and you should see a simulation. Comparison with the empirical spectrum generated in the related worked example, The Photoelectron Spectrum of H2O shows that the intensities are reasonable, though both the ionization energy and vibrational frequencies need adjustment.

The resulting file is available as H2OCAS.pgo.